The typical goal of an eCLIP experiment is to identify RNA associated with a target of interest. The target can be an RNA-binding protein (RBP-eCLIP), miRNAs (miR-eCLIP), or methylation (m6A-eCLIP) but the end goal is usually the same: where is and how enriched is the target of interest? This eBlog will walk through how to answer these questions using RBP-eCLIP as an example.
As part of an RBP-eCLIP experiment two libraries are generated: an immunoprecipitated (IP) and an input library. To generate the IP library, RNA is crosslinked and then fragmented to produce short pieces of RNA that are bound to proteins. An antibody is used to enrich for RNAs that are bound to the target of interest. To generate the input library, RNA of similar size to the IP library is collected. The libraries undergo further preparation and are sequenced.
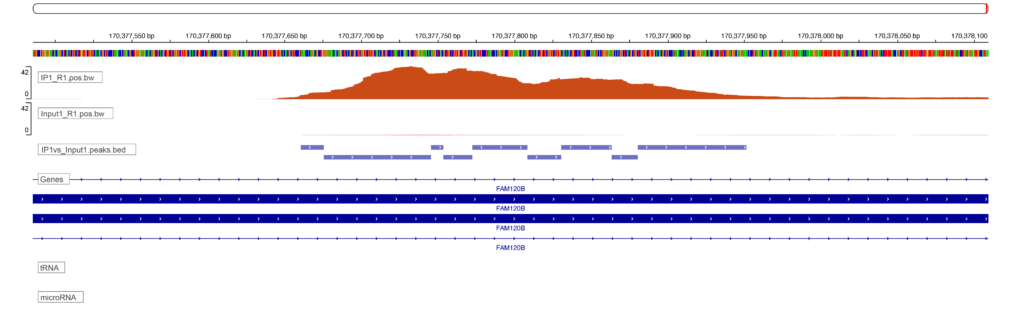
Sequencing results in the generation of files that contain the nucleotide sequences associated with either the RBP or the input for each sample. These sequences are then aligned to the genome, a process which enables us to know which gene and which gene feature is associated with each read. We can examine where reads accumulate on a genome browser (below figure, these enriched regions are called peaks due to their resemblance to mountains among valleys of low signal) but that type of evaluation is qualitative and prone to error. We instead use a peak calling algorithm to robustly identify sites of RBP enrichment.
At Eclipsebio we identify peaks using the CLIPper algorithm which was developed by Gene Yeo’s lab and used for all ENCODE RBP-eCLIP analyses1. Unlike the traditional peak callers used for other assays like ChIP-Seq or ATAC-Seq where the DNA content of the sample is constant, a special approach is needed for eCLIP to account for both the level of RBP binding and the level of gene expression.
CLIPper looks at each gene in the genome and finds regions with a minimum number of reads in the IP library, and then fits a curve to the region using cubic splines. To account for differences in gene expression, the significance of enriched clusters of reads is based off the number of reads in the peak relative to the number of other reads on the gene and the length of that gene.
Identified clusters could be true peaks of RBP enrichment or they could instead be false positives, regions of the transcriptome that tend to accumulate reads over other regions. We use the input libraries to help reduce the false positive rate, for each identified cluster we calculate the fold-change enrichment of the IP library to the input library. To be classified as a peak, the IP library has to have a log2-transformed fold enrichment greater than or equal to a set threshold (typically 3).
Once peaks of RBP-binding are identified, we annotate them with the associated gene and gene feature. This allows us to examine if specific genes are targeted by an RBP or if some gene features such as 3’ UTRs are highly enriched. We also perform gene ontology analyses to get an overview of what classes of genes are being regulated by the RBP.
Performing an analysis of eCLIP data is complicated but Eclipsebio is here to help. Our experts have years of experience in generating eCLIP libraries and analyzing the data. Contact us today to find out how we can help you achieve your goals.
References
Latest eBlogs
Charting a New Era: How RNA Is Unlocking N‑of‑1 Cures
RNA is unlocking the ability to develop life‑saving therapies at unprecedented speed. The recent success with baby KJ demonstrates how RNA medicine can move a personalized treatment from diagnosis to clinic in less than a year.
The three pillars of AI in RNA biology: why data is the hardest to get right
Artificial intelligence (AI) is transforming how we approach RNA research and drug discovery. In this eBlog we review how data is one of the key pillars for the successful use of AI.