The goal of RBP-eCLIP is to identify where an RNA-binding protein (RBP) is binding; these regions are often called peaks due to their mountain-like appearance on a genome browser. After peaks have been called, it is important to determine what genes and gene features are associated with those sites. For example, an RBP binding to an intron of a gene likely has a different regulatory role than a different RBP that binds to the 3’ UTR of the same gene. Determining how to annotate an RBP peak is a non-trivial task, and in this post we will walk you through how we perform this analysis.
The first step in annotating peaks is to obtain a high-quality reference for where different genes are in the genome. At Eclipsebio we often use GENCODE or Ensembl references, both of which have been developed over many years to contain well validated gene models. For each gene, we have identified the regions that correspond to different features such untranslated regions (UTRs), introns, and coding sequences (CDS). A diagram of a basic gene model is in figure 1 and an explanation of the different features we examine is in table 1.
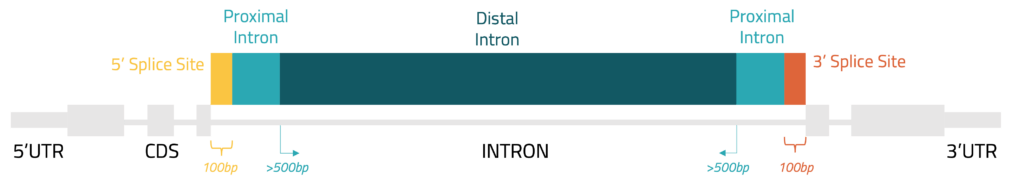
Figure 1: Gene features used during peak annotation
| Region | Definition | Potential Function |
| Coding sequence (CDS) | Sequence of an mRNA that codes for a protein | - mRNA stability (2) - Translation efficiency (2,3) - Splicing (3) |
| 5’ UTR | Untranslated region between the transcription start site and start codon | - Transcript initiation (3) - Translation regulation (3) |
| 3’ UTR | Untranslated region between the stop codon and transcription end site | - mRNA stability (5) - miRNA regulation (4) - Translation efficiency (6) |
| Splice site | Intronic region that is within the first 100 (5’) or last 100 (3’) nt of an intron | - Splicing (1) |
| Proximal intron | Intronic region that is between 100 and 500 nt from the nearest exon | - Splicing (1) - Localization (1) |
| Distal intron | Intronic region that is more than 500 nt from the nearest exon | - Transcription regulation (3) - Pre-mRNA processing (3) |
Although one could perform a simple overlap to identify which peaks are associated with gene features, this can lead to problematic assignments as there will often be cases where genes overlap. This can lead to a given site being in the CDS of one gene and in the intron of another. To help solve this issue we have developed a hierarchy for peak assignments where regions are prioritized in the order of CDS > UTR > introns > non-coding exons > non-coding introns(1).
It can be challenging to set-up an accurate annotation of eCLIP peaks. Luckily, Eclipsebio is here to help. Our analysis pipelines provide robust labeling of peaks across different sample types and genomes. Contact us today about how we can help you achieve your research goals.
References
Latest eBlogs
Charting a New Era: How RNA Is Unlocking N‑of‑1 Cures
RNA is unlocking the ability to develop life‑saving therapies at unprecedented speed. The recent success with baby KJ demonstrates how RNA medicine can move a personalized treatment from diagnosis to clinic in less than a year.
The three pillars of AI in RNA biology: why data is the hardest to get right
Artificial intelligence (AI) is transforming how we approach RNA research and drug discovery. In this eBlog we review how data is one of the key pillars for the successful use of AI.