RNA-binding proteins (RBPs) are a diverse class of proteins that bind to and regulate RNA transcripts. RBPs can recognize their targets by binding to specific sequences of RNA (called motifs) and/or by binding to specific structural conformations (for example, ADAR1 binds to double-stranded RNA).
The simplest definition of a motif is a short, patterned sequence of nucleotides that play some role in the biology of a system. In the case of RBPs, this role is to bind selectively to defined regions of a given RBP’s protein structure enabling RBPs to target specific transcripts and specific gene features. For example, RBFOX2 has a strong motif that is enriched in introns. The specificity of both this motif sequence and its location within transcripts enables RBFOX2 to have targeted actions with profound implications in development and disease. This was seen in a recent publication that used AGO2 CLIP-seq to probe how the loss of RBFOX2 led to stress-induced changes in the expression and gene targeting of a specific microRNA (1).

At Eclipsebio we identify motifs using a software tool called HOMER. For these analyses a target collection of sequences is obtained, and small subsequences are examined to see if they occur more frequently in the target regions than in the background regions. For RBP-eCLIP experiments the target sequences are regions where a given RBP has experimentally been determined to bind. These regions are called peaks and are sites where reads accumulate in RBP-immunoprecipitated libraries over background RNA input libraries. Importantly, a similar analysis can be performed for other types of eCLIP assays such as m6A-eCLIP, where the analysis is used to confirm that the expected DRACH motif is present.
HOMER-identified motifs have an associated significance which is calculated by performing a statistical test. That significance is usually interpreted in combination with the percentage of target regions with the motif. A strong motif should occur frequently in the target regions and be significant compared to the background.
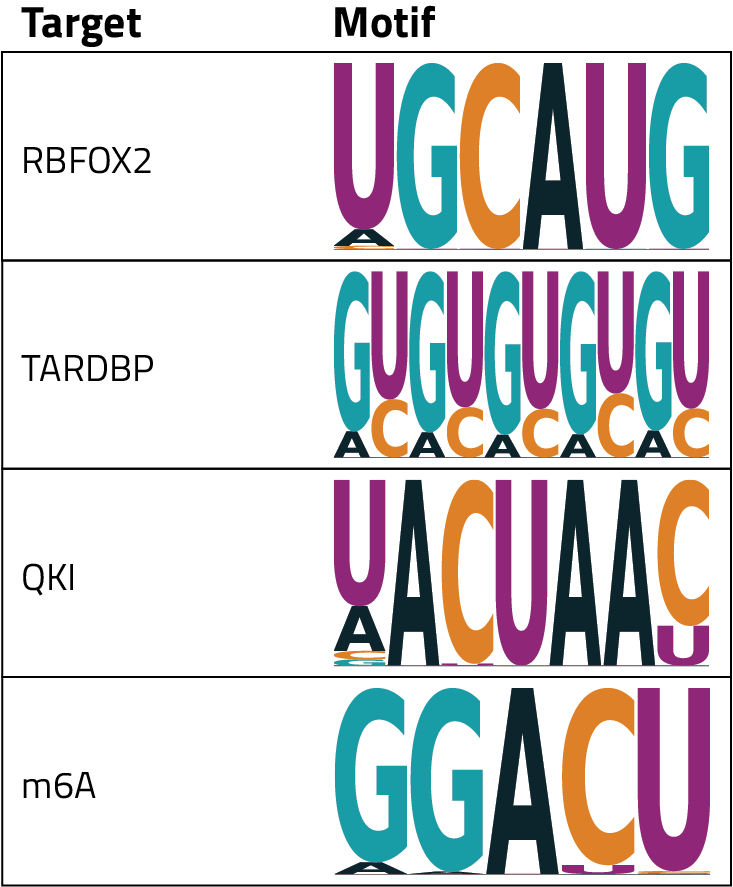
HOMER’s direct output is a table that shows the relative enrichment of each nucleotide at each position of the motif. To help with interpretation these tables are visualized in a specific type of plot called a motif logo. In these plots, each point along the x-axis is a position in the motif and letters are plotted for each nucleotide that is potentially present at that position. The size of the nucleotide indicates the relative frequency that that base appears in the motif, a larger letter means that it is more likely to appear across the examined regions. The logo plots for some common RBPs and targets are shown in the table.
As part of Eclipsebio’s eCLIP services you don’t need to worry about performing eCLIP or identifying binding motifs on your own. Our team has years of experience in generating high quality libraries and performing analyses to examine different RBPs. As part of our standard service, you will receive a detailed interactive report that includes motif enrichment analysis.
References
Latest eBlogs
Charting a New Era: How RNA Is Unlocking N‑of‑1 Cures
RNA is unlocking the ability to develop life‑saving therapies at unprecedented speed. The recent success with baby KJ demonstrates how RNA medicine can move a personalized treatment from diagnosis to clinic in less than a year.
The three pillars of AI in RNA biology: why data is the hardest to get right
Artificial intelligence (AI) is transforming how we approach RNA research and drug discovery. In this eBlog we review how data is one of the key pillars for the successful use of AI.
